A internal function used for the plotting of trees
plot_tree.RdA internal function used for the plotting of trees
plot_tree(
  tree,
  HI = NULL,
  color_by = NULL,
  linewidth = 1,
  pointsize = 1,
  textsize = 2.5,
  labeller_function = NULL,
  keep_conf_label = FALSE,
  subset = NULL
)
Arguments
- tree
object of class phylo to plot.
- HI
(optional) HI of the tree (unused).
- color_by
(optional) lookup table with color labels (NULL).
- linewidth
(optional) numeric value defining linewidth of tree edges (1).
- pointsize
(optional) numeric value defining point size of tree tips (1).
- textsize
(optional) numeric value defining linewidth of tree edges (2.5).
- labeller_function
(optional) HI of the tree (unused).
- keep_conf_label
(optional) Flat indicating if `confidence label' should be keeped (default: FALSE).
- subset
(optional) character vector defining a subset of samples to plot.
Value
ggplot object
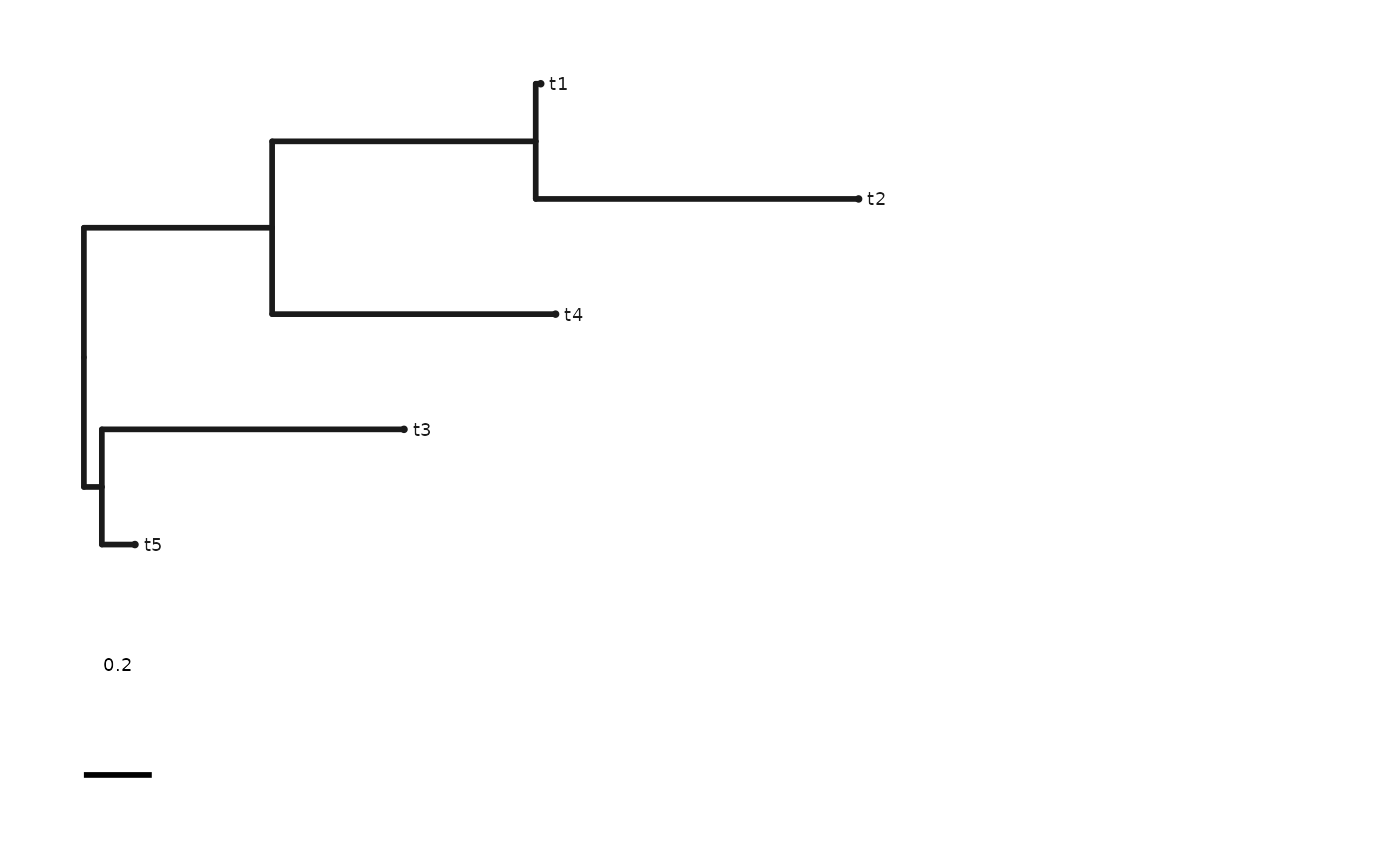
Examples
plot_tree(ape::rtree(5))