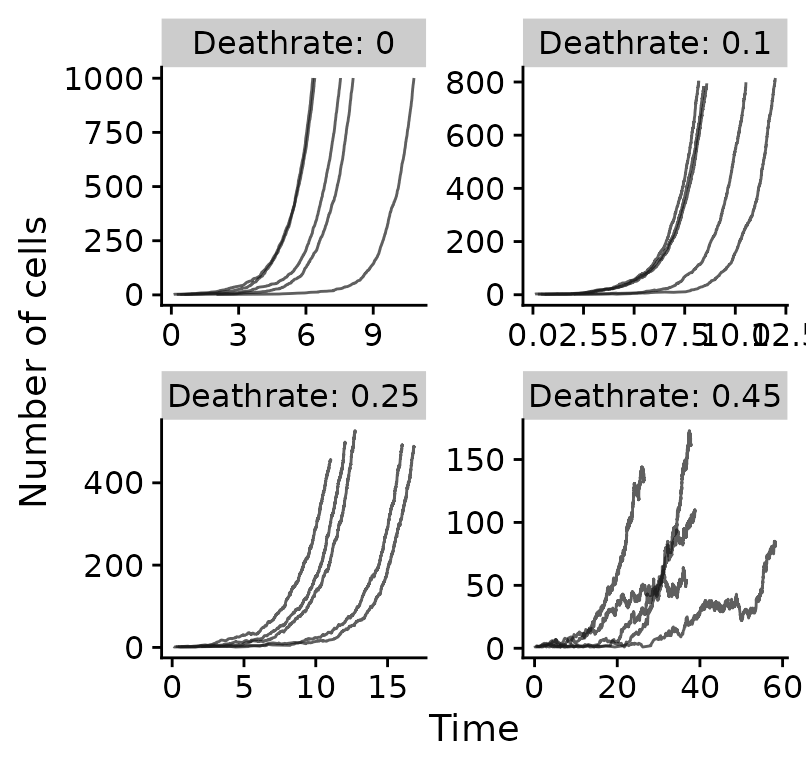
Neutral tumours with variable death rates
# fixed parameters, a neutral tumour:
fixed_clone_params_neutral =
  data.frame(
    birthrate = 1,
    mutationrate = 1,
    start_time = 0,
    father = 0
  )

# varied parameters:
n_reactions = 1:1000
seeds = 1:5
deathrates = c(0, 0.1, 0.25, 0.45)
# create all simulations:
all_results_neutral = NULL

for (dr in deathrates) {
  for (s in seeds) {

    this_params = fixed_clone_params_neutral %>% mutate(deathrate=dr)
    sim = new(TEMULATOR_object, this_params, 0, 100, s) # construct temulator object

    for (n in n_reactions) {

      sim$end_time = n # 1) update the end time
      sim$run(FALSE)   # 2) run forward, not verbose

      result_this_simulation =
        data.frame(
          reactions=sim$n_reactions,
          t=sim$simulation_time,
          cells=sum(sim$cell_counts),
          seed=s,
          dr=dr
        )

      all_results_neutral =
        rbind(
          all_results_neutral,
          result_this_simulation
        )

    }
  }
}
all_results_neutral %>%
  ggplot(aes(x=t, y=cells, group=seed)) +
    geom_line(alpha=0.7, color="gray10") +
    scale_color_brewer(palette="Set1") +
    xlab("Time") +
    ylab("Number of cells") +
    guides(color=FALSE) +
    facet_wrap(~paste0("Deathrate: ", dr), ncol=2, scales="free")
#> Warning: `guides(<scale> = FALSE)` is deprecated. Please use `guides(<scale> =
#> "none")` instead.
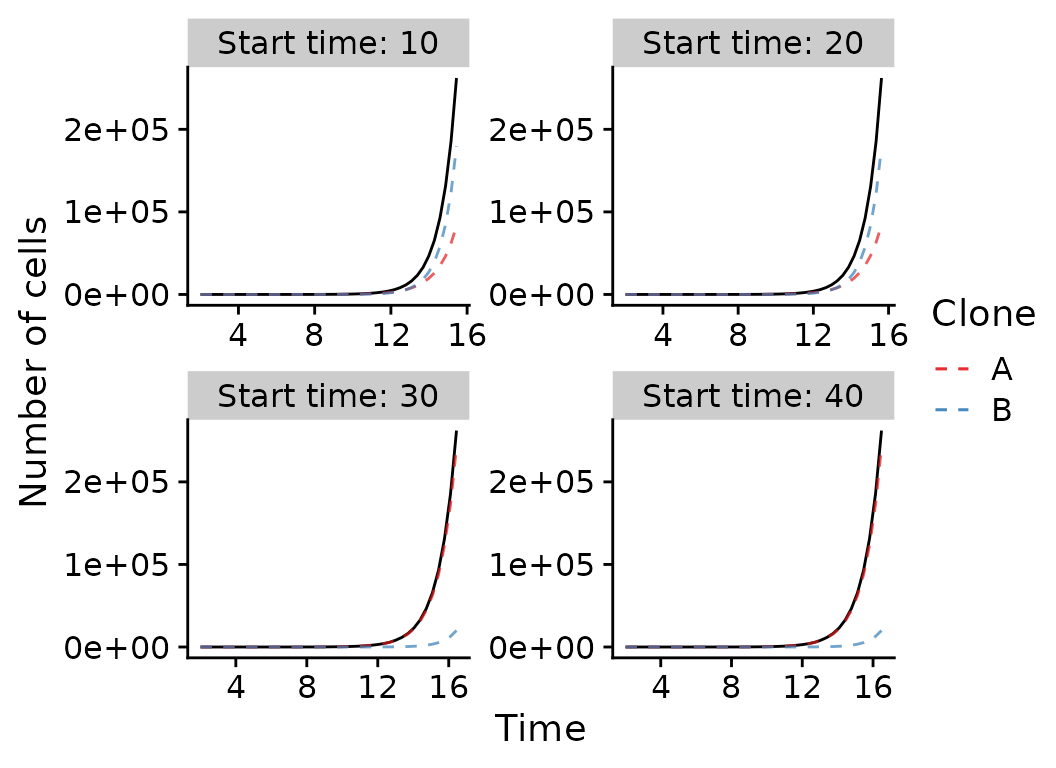
One subclone with variable higher birth rate
# fixed parameters, a non-neutral tumour:
fixed_clone_params_selection =
  data.frame(
    birthrate = c(1, 1.3),
    mutationrate = c(1, 1),
    father = c(0, 0),
    deathrate = c(0,0)
  )


# varied parameters:
n_reactions = unique(round(2^seq(from=0, to=18, by=0.5)))
seeds = 1
start_times = c(10, 20, 30, 40)
# create all simulations:
all_results_selection = NULL

for (st in start_times) {
  for (s in seeds) {

    this_params = fixed_clone_params_selection %>% mutate(start_time=c(0, st))
    sim = new(TEMULATOR_object, this_params, 0, 100, s)

    for (n in n_reactions) {

      sim$end_time = n  # 1) update the end time
      sim$run(FALSE)    # 2) run forward, not verbose

      result_this_simulation =
        data.frame(
          reactions=sim$n_reactions,
          t=sim$simulation_time,
          cells=sum(sim$cell_counts),
          clone1=sim$cell_counts[1],
          clone2=sim$cell_counts[2],
          seed=s,
          start_time=st
        )

       all_results_selection =
        rbind(
          all_results_selection,
          result_this_simulation
        )

    }
  }
}
all_results_selection %>%
  mutate(clone2=ifelse(is.na(clone2), 0, clone2)) %>%
  ggplot(aes(x=t, y=cells, group=seed)) +
    geom_line(alpha=1.0) +
    geom_line(alpha=0.7, aes(color="A", y=clone1), linetype=2) +
    geom_line(alpha=0.7, aes(color="B", y=clone2), linetype=2) +
    scale_color_brewer(palette="Set1") +
    xlab("Time") +
    ylab("Number of cells") +
    labs(color="Clone") +
    facet_wrap(~paste0("Start time: ", start_time), ncol=2, scales="free")
Sequencing samples showing a selective sweep
# fixed parameters, a non-neutral tumour:
fixed_clone_params_sample =
  data.frame(
    birthrate = c(1, 1.3),
    mutationrate = c(10, 10),
    father = c(0, 0),
    deathrate = c(0, 0),
    start_time = c(0, 40)
  )

seed = 1

# varied parameters:
n_reactions = unique(round(2^seq(from=0, to=25, by=0.5)))

# parameters for sequencing
min_vaf = 0.05   # 1% limit of detection
depth = 100      # 100x mean coverage
depth_model = 1  # poisson distribution
purity =  1.0    # a pure tumour
clone_f_selection_sweep = NULL
samples_selection_sweep = NULL

# create temulator object
sim = new(TEMULATOR_object, fixed_clone_params_sample, 0, 100, seed)

for (n in n_reactions) {

  # update simulation
  sim$end_time = n  # 1) update the end time
  sim$run(FALSE)    # 2) run forward, not verbose

  # cell count data
  cell_counts_this =
    data.frame(
      reactions=sim$n_reactions,
      time=sim$simulation_time,
      cells=sum(sim$cell_counts),
      clone1=sim$cell_counts[1],
      clone2=sim$cell_counts[2],
      seed=s,
      start_time=st
    ) %>% mutate(clone2=ifelse(is.na(clone2), 0, clone2))


  # sequencing data
  sample_this =       # (see ?simulateTumour for details)
    sim$sample_seeded(min_vaf, purity, depth, depth_model, seed) %>%
    mutate(vaf = alt/depth) %>%
    mutate(n_reactions = n) %>%
    mutate(time = sim$simulation_time)


  # append data to result sets
  clone_f_selection_sweep = rbind(clone_f_selection_sweep, cell_counts_this)
  samples_selection_sweep = rbind(samples_selection_sweep, sample_this)

  # break loop if full sweep of subclone observed?
  if (cell_counts_this$clone2 / cell_counts_this$cells > 0.9) break()
}
plot_selection_sweep =
  samples_selection_sweep %>%
  mutate(mlabel=TEMULATOR:::assign_mutation_label(.)) %>%
  filter(!is.na(vaf)) %>%
  ggplot(aes(x=vaf, fill=factor(mlabel))) +
      geom_histogram(breaks=seq(from=min_vaf, 1, by = 0.01)) +
      scale_fill_brewer(palette = "Set1") +
      xlab("VAF") +
      ylab("Number of mutations") +
      labs(fill="Group") +
      labs(title="Selective sweep") +
      labs(subtitle = "t = {signif(frame_time, 2)}") +
      xlim(-0.01, 1.0) +
      transition_time(time)  +
      #theme( legend.position="bottom") +
      scale_fill_brewer(
        palette = "Set1",
        limits = names(cl_id_names),
        breaks = names(cl_id_names),
        labels = cl_id_names,
        drop = FALSE
      )
#> Scale for 'fill' is already present. Adding another scale for 'fill', which
#> will replace the existing scale.


plot_selection_sweep =
  plot_selection_sweep +
  # box marking limit of detection
  geom_polygon(data=data.frame(x=c(0, 0, min_vaf, min_vaf), y=c(0, Inf, Inf, 0)),
               aes(x=x,y=y), fill="gray90", inherit.aes = FALSE) +
  # line showing expected VAF of subclone
  geom_vline(data=clone_f_selection_sweep, aes(xintercept=clone2 / cells * 0.5),
             linetype=2, color="gray20") +
  # label of subclone line
  geom_text(data=clone_f_selection_sweep, aes(x=clone2 / cells * 0.5 + 0.025),
            label=factor("Exp. VAF subclone"),
            hjust=0, vjust=0.5, y=25, color="gray20", inherit.aes = FALSE)

anim = animate(plot_selection_sweep, width=450, height=220)
anim_save("tumour.gif", anim)